Trading
Aprenda sobre el soporte y la resistencia en el comercio de criptomonedas y cómo afectan al comportamiento del mercado.

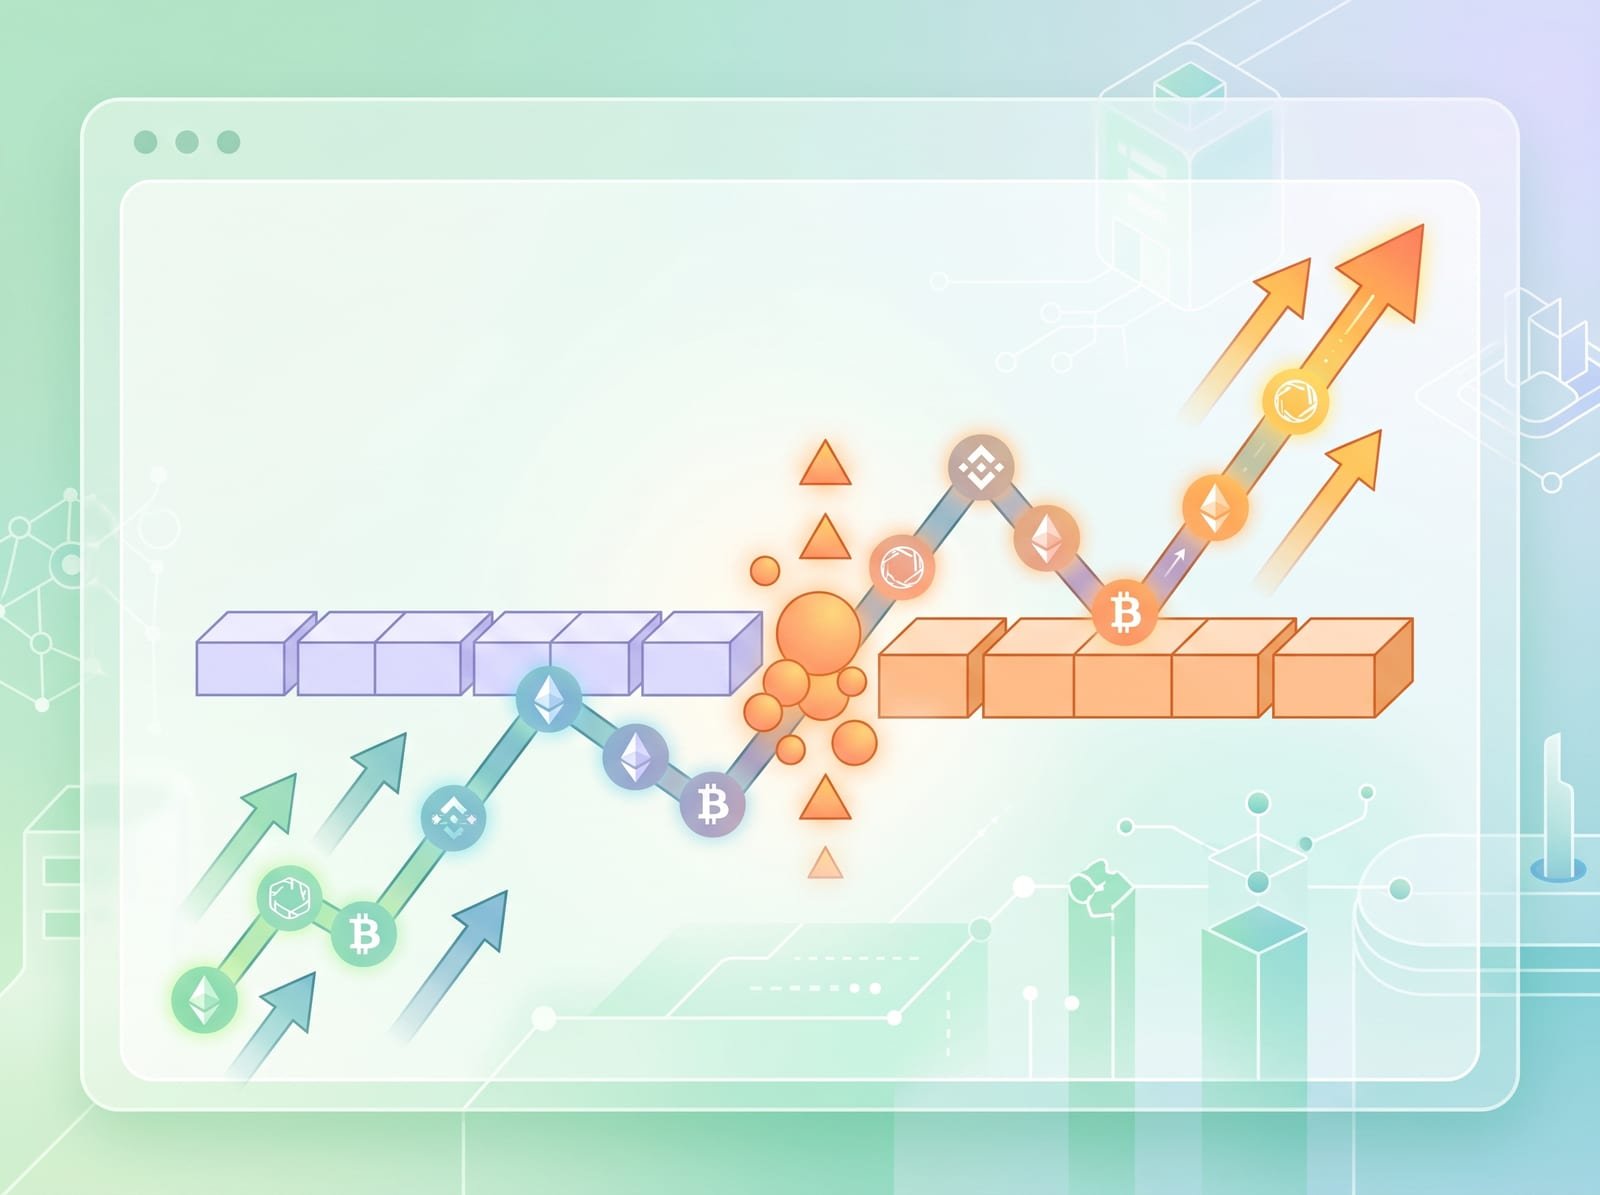
El soporte actúa como un suelo de precios, mientras que la resistencia sirve como un techo de precios, influyendo en las tendencias del mercado.
El soporte y la resistencia pueden ser psicológicos, basados en la línea de tendencia o en la media móvil, y cada uno de ellos ofrece diferentes perspectivas del mercado.
La combinación de varios indicadores refuerza las señales de negociación, pero requiere precaución, ya que ningún método es infalible.
En el ámbito del trading de criptomonedas, los niveles de soporte y resistencia desempeñan un papel crucial. Estos términos describen puntos de precio en un gráfico que a menudo actúan como barreras para el movimiento de los precios. Aunque a primera vista parecen sencillos, aplicarlos de forma eficaz requiere habilidad debido a la naturaleza siempre cambiante de los mercados. Comprender estos niveles es una piedra angular del análisis técnico, que implica estudiar datos históricos del mercado para predecir tendencias futuras de los precios. Identificar el soporte y la resistencia puede ayudar a los operadores a determinar cuándo entrar o salir de las operaciones, gestionar los riesgos y tomar decisiones bien fundamentadas.
El soporte actúa como un suelo en el que una tendencia bajista de los precios puede detenerse debido al aumento del interés comprador. Imagínalo como un nivel en el que el precio lucha por no caer más. Por el contrario, la resistencia funciona como un techo en el que una tendencia alcista podría ralentizarse debido a la presión vendedora. Aunque a menudo se representan como líneas, el soporte y la resistencia se consideran más acertadamente como zonas. Esto se debe a que los precios de mercado pueden fluctuar en torno a estos niveles antes de establecer una dirección clara.
Los operadores utilizan los niveles de soporte y resistencia para identificar posibles puntos de reversión o pausas en el movimiento de los precios. Cuando los precios se acercan a estos niveles, hay dos resultados posibles: los precios pueden rebotar o romper los niveles. Una ruptura puede dar lugar a un cambio de soporte a resistencia, en el que se invierten los papeles de los niveles. Los operadores suelen colocar órdenes stop-loss en torno a estas zonas para gestionar el riesgo, ya que estas órdenes pueden limitar las pérdidas potenciales si los precios se mueven de forma desfavorable.
Los niveles de soporte y resistencia se presentan en diversas formas, cada una de las cuales ofrece una perspectiva única sobre el comportamiento del mercado.
Estos niveles se dan en cifras redondas, como 10, 100 o 1000 dólares. Muchos operadores establecen de forma natural sus órdenes de compra o venta en estas cifras, lo que las convierte en puntos de interés significativos.
Las líneas de tendencia son líneas diagonales en un gráfico que conectan una serie de puntos de precio. Pueden actuar como soporte o resistencia e indicar la dirección general del mercado. Reconocer estas líneas a tiempo puede ser beneficioso para predecir los movimientos futuros de los precios.
Las medias móviles, que muestran el precio medio de un activo durante un periodo específico, también pueden actuar como niveles dinámicos de soporte o resistencia. Los operadores las utilizan para evaluar la salud general del mercado e identificar posibles puntos de reversión.

La confluencia se produce cuando múltiples indicadores o estrategias sugieren el mismo resultado de mercado. Los niveles de soporte y resistencia ganan fuerza cuando se alinean con otras señales técnicas, como medias móviles o patrones de precios anteriores. Por ejemplo, una zona de soporte que coincida con un área de resistencia previa, una media móvil clave y un número psicológico probablemente sea más sólida. Si bien la confluencia puede mejorar la fiabilidad de las señales de trading, es fundamental recordar que ninguna estrategia es infalible. Las condiciones del mercado pueden cambiar rápidamente, por lo que los traders deben estar preparados para diferentes resultados.

El soporte y la resistencia son conceptos fundamentales en el análisis del mercado de las criptomonedas. Al comprender cómo funcionan estos niveles y reconocer sus tipos, los traders pueden orientarse mejor en las complejidades del comportamiento del mercado. Aunque estas herramientas ofrecen información valiosa, deben utilizarse junto con otras estrategias y prácticas de gestión de riesgos para tomar decisiones de trading informadas.
Esta lección ha sido reescrita por Prison Professors con fines educativos, inspirándose en Binance Academy. El artículo original sigue siendo propiedad de sus autores.
Aviso legal: Este material se ha elaborado únicamente con fines informativos generales y NO debe: (1) considerarse una recomendación o un consejo individualizado; ni (2) servir de base para ninguna actividad de inversión. Toda la información se proporciona «tal cual» y está sujeta a cambios sin previo aviso; no ofrecemos ninguna garantía de ningún tipo, expresa o implícita, en cuanto a la exactitud, validez, fiabilidad, disponibilidad o integridad de dicha información. Prison Professors Charitable Corporation NO ofrece asesoramiento en materia de inversiones, legal o fiscal de ninguna manera ni forma. La responsabilidad de cualquier decisión de inversión recae exclusivamente en usted, tras analizar todos los posibles factores de riesgo y ejercer su propio criterio independiente. Prison Professors Charitable Corporation no se hace responsable de ninguna consecuencia derivada de ello.
Después de leer esta lección, reflexiona sobre las siguientes preguntas. Escribe al menos de dos a cuatro párrafos para cada pregunta. Puedes utilizar tus respuestas como anotaciones en tu diario o como informes de la lección en tu perfil de Profesores de Prisiones.