Trading
Descubra cómo el análisis técnico ayuda a evaluar los mercados de criptomonedas utilizando datos y tendencias de precios anteriores.

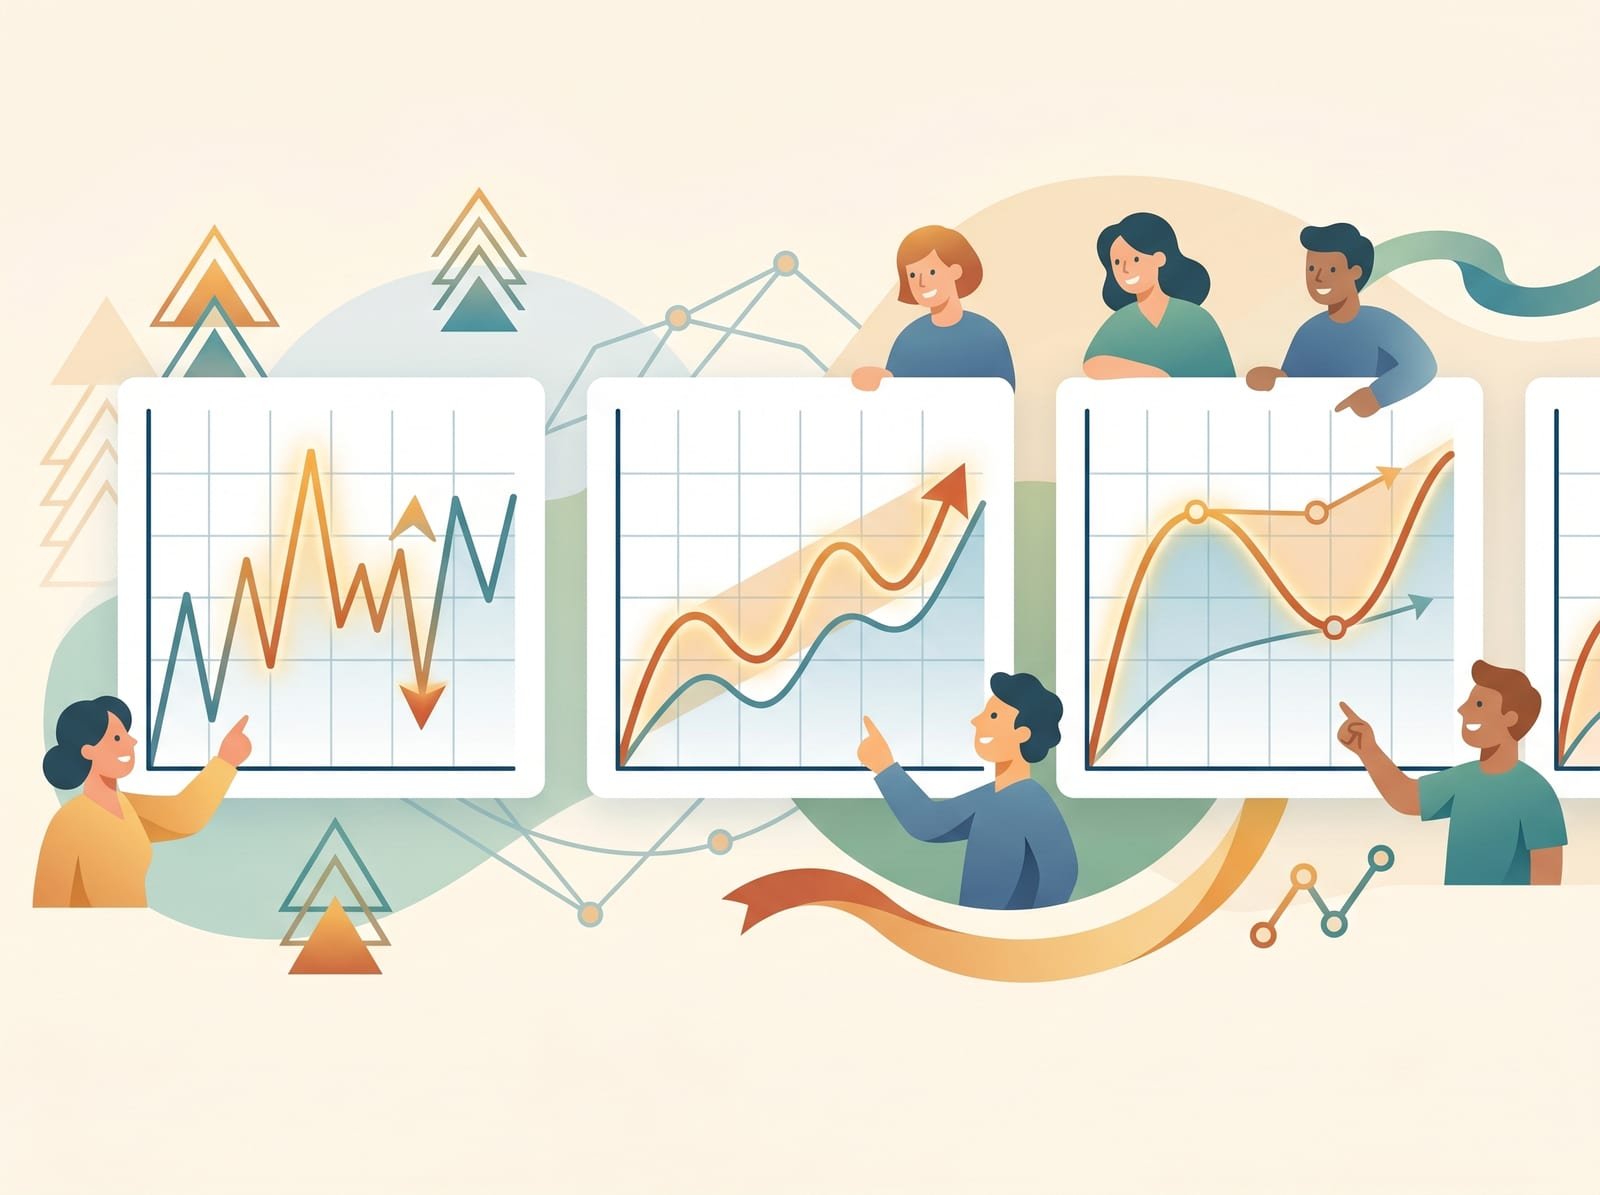
El análisis técnico identifica las tendencias del mercado y ayuda a predecir los movimientos de los precios utilizando datos históricos.
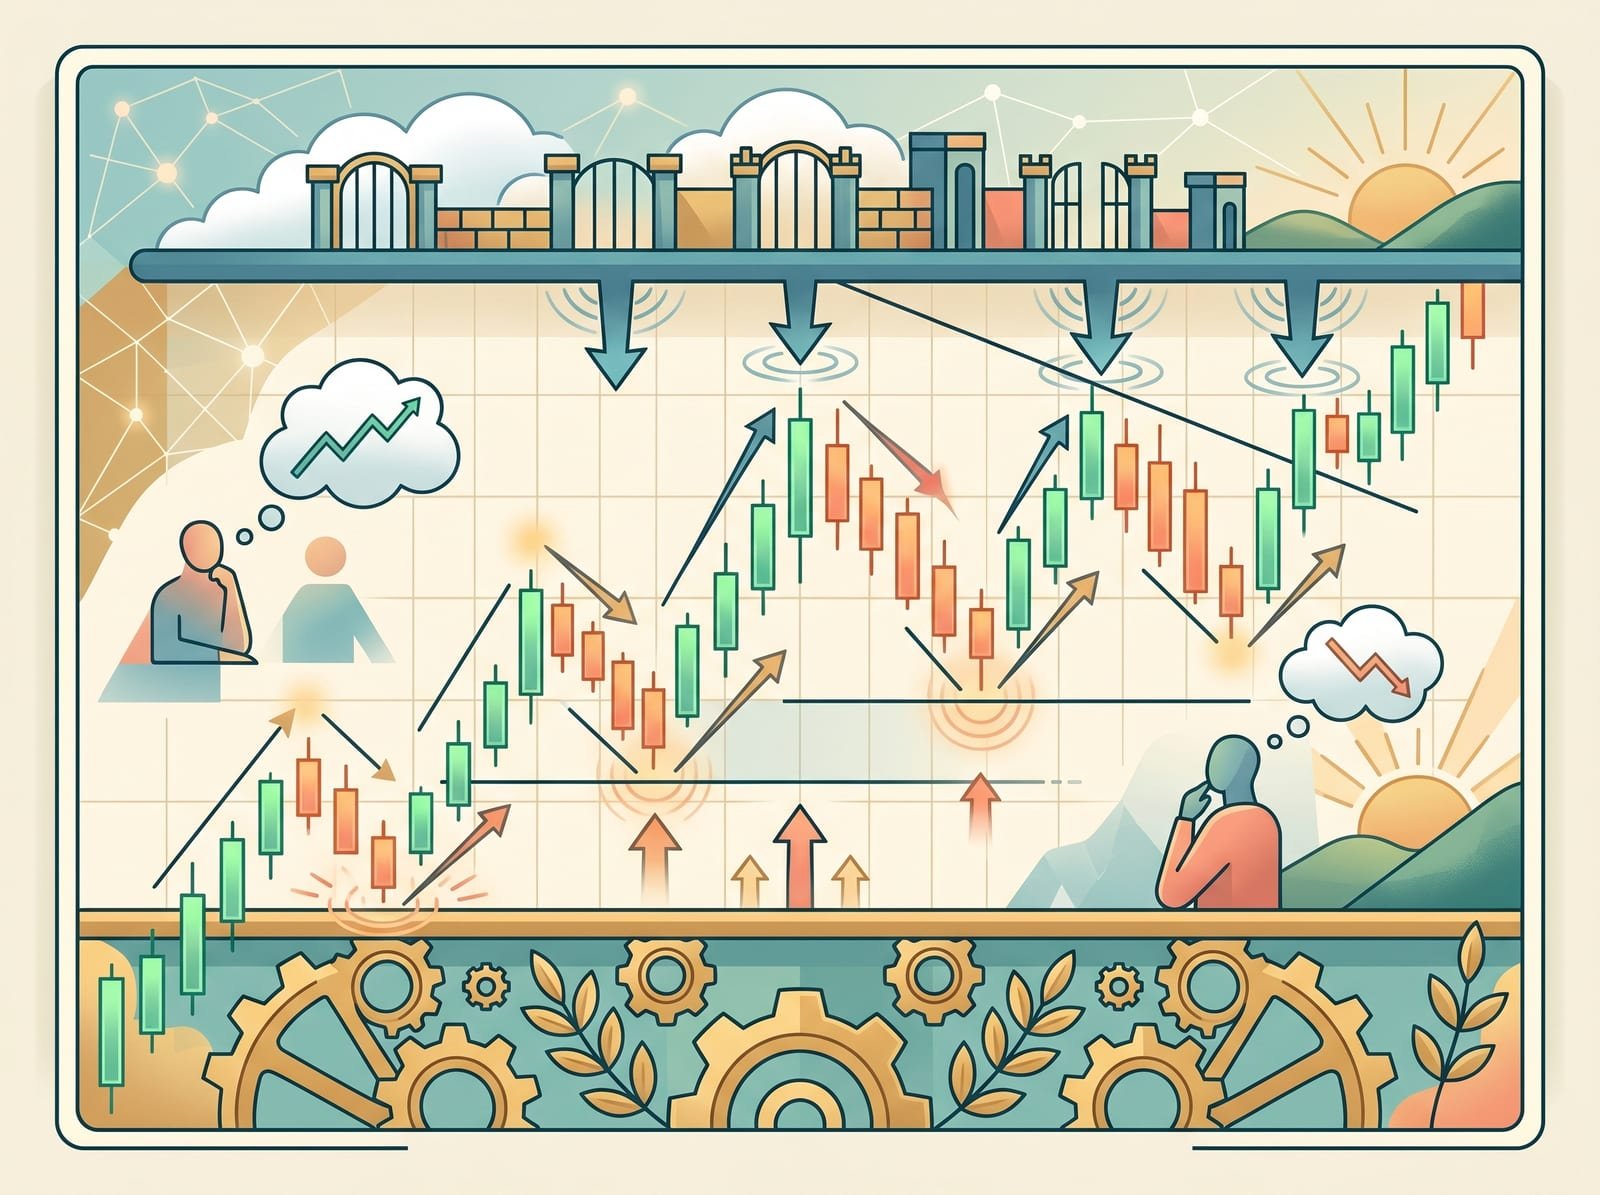
Las zonas de soporte detienen las caídas de precios, mientras que las zonas de resistencia detienen las subidas, indicando posibles puntos de inflexión del mercado.
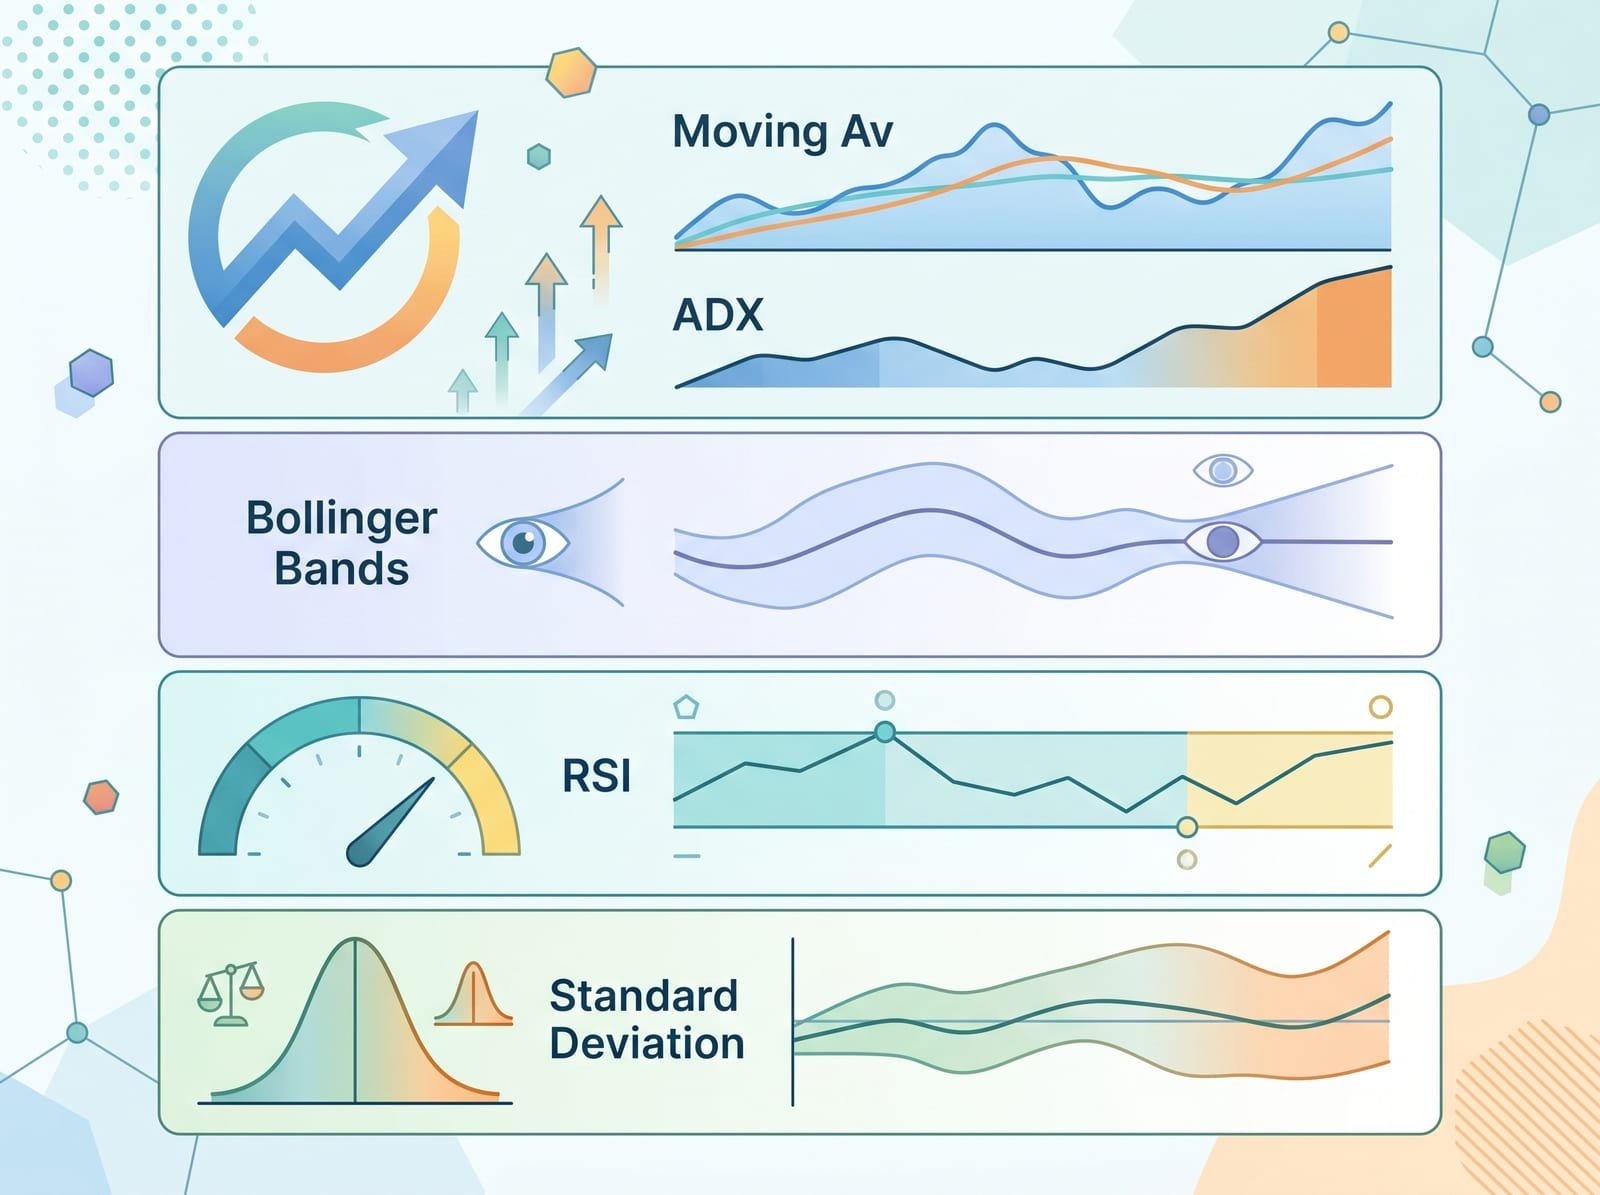
Indicadores como el ADX, las bandas de Bollinger y el RSI proporcionan información sobre la fortaleza y la volatilidad del mercado.
Aunque el análisis técnico ayuda a desarrollar la estrategia, requiere una cuidadosa gestión del riesgo y no garantiza el éxito.
El análisis técnico es un método que utilizan los operadores para evaluar oportunidades de negociación mediante el examen de los datos del mercado, en particular el precio y el volumen. A diferencia del análisis fundamental, que tiene en cuenta factores económicos externos, el análisis técnico se centra en los movimientos de precios pasados para predecir el comportamiento futuro. Este enfoque se utiliza ampliamente en diversos mercados, incluyendo acciones, materias primas y criptomonedas. En el contexto de las criptomonedas, el análisis técnico puede ayudar a los operadores a identificar tendencias y a tomar decisiones informadas sobre la compra o venta de activos digitales.
Los operadores emplean el análisis técnico para comprender el sentimiento del mercado y anticipar los cambios en los precios. Al estudiar los gráficos y los datos históricos, buscan patrones que sugieran posibles movimientos de precios. Este método se basa en la idea de que la historia del mercado tiende a repetirse y que los precios se mueven siguiendo tendencias identificables. En el trading de criptomonedas, el análisis técnico resulta especialmente útil debido a la alta volatilidad del mercado. Al identificar zonas de soporte y resistencia, los traders pueden predecir mejor dónde podrían estabilizarse o revertirse los precios. Una zona de soporte es aquella en la que una caída de precios podría detenerse debido a un mayor interés comprador, mientras que una zona de resistencia es aquella en la que una subida de precios podría detenerse debido a un mayor interés vendedor.
El bitcoin, al igual que otras criptomonedas, es conocido por la volatilidad de sus precios. El análisis técnico ofrece herramientas para lidiar con esta volatilidad centrándose en los datos históricos de precios. Los operadores suelen analizar diferentes marcos temporales, como gráficos de 15 minutos, una hora, cuatro horas y diarios, para encontrar patrones y tendencias. El objetivo es utilizar este análisis para tomar decisiones estratégicas de trading. Aunque no garantiza el éxito, puede ayudar a los traders a abordar el mercado con una estrategia más clara, reduciendo la influencia de las emociones.
En el análisis técnico de las criptomonedas se emplean habitualmente varias herramientas e indicadores:
El análisis técnico puede ser una herramienta valiosa para los operadores de criptomonedas, ya que ayuda a eliminar la emoción de las decisiones de trading y proporciona un enfoque estructurado para el análisis de mercado. Aunque ofrece información sobre el comportamiento del mercado, es importante recordar que no garantiza resultados positivos. El trading exitoso implica una combinación de estrategias y una gestión cuidadosa del riesgo. Mientras te preparas para la vida tras la puesta en libertad, comprender el análisis técnico podría mejorar tus conocimientos financieros y abrirte las puertas a posibles oportunidades en campos relacionados con la tecnología. Aborda siempre el trading con precaución y un juicio informado.
Esta lección ha sido reescrita por Prison Professors con fines educativos, inspirándose en Binance Academy. El artículo original sigue siendo propiedad de sus autores.
Aviso legal: Este material se ha elaborado únicamente con fines informativos generales y NO debe: (1) considerarse una recomendación o un consejo individualizado; ni (2) servir de base para ninguna actividad de inversión. Toda la información se proporciona «tal cual» y está sujeta a cambios sin previo aviso; no ofrecemos ninguna garantía, expresa o implícita, respecto a la exactitud, validez, fiabilidad, disponibilidad o integridad de dicha información. Prison Professors Charitable Corporation NO ofrece asesoramiento en materia de inversiones, legal o fiscal de ninguna manera ni forma. La responsabilidad de cualquier decisión de inversión recae exclusivamente en usted, tras analizar todos los posibles factores de riesgo y ejercer su propio criterio independiente. Prison Professors Charitable Corporation no se hace responsable de ninguna consecuencia derivada de ello.
Después de leer esta lección, reflexiona sobre las siguientes preguntas. Escribe al menos de dos a cuatro párrafos para cada pregunta. Puedes utilizar tus respuestas como anotaciones en tu diario o como informes de la lección en tu perfil de Profesores de Prisiones.