Trading
Learn how to read candlestick charts to understand cryptocurrency market trends effectively.

Candlestick charts visually represent price movements over time, helping traders understand market trends.
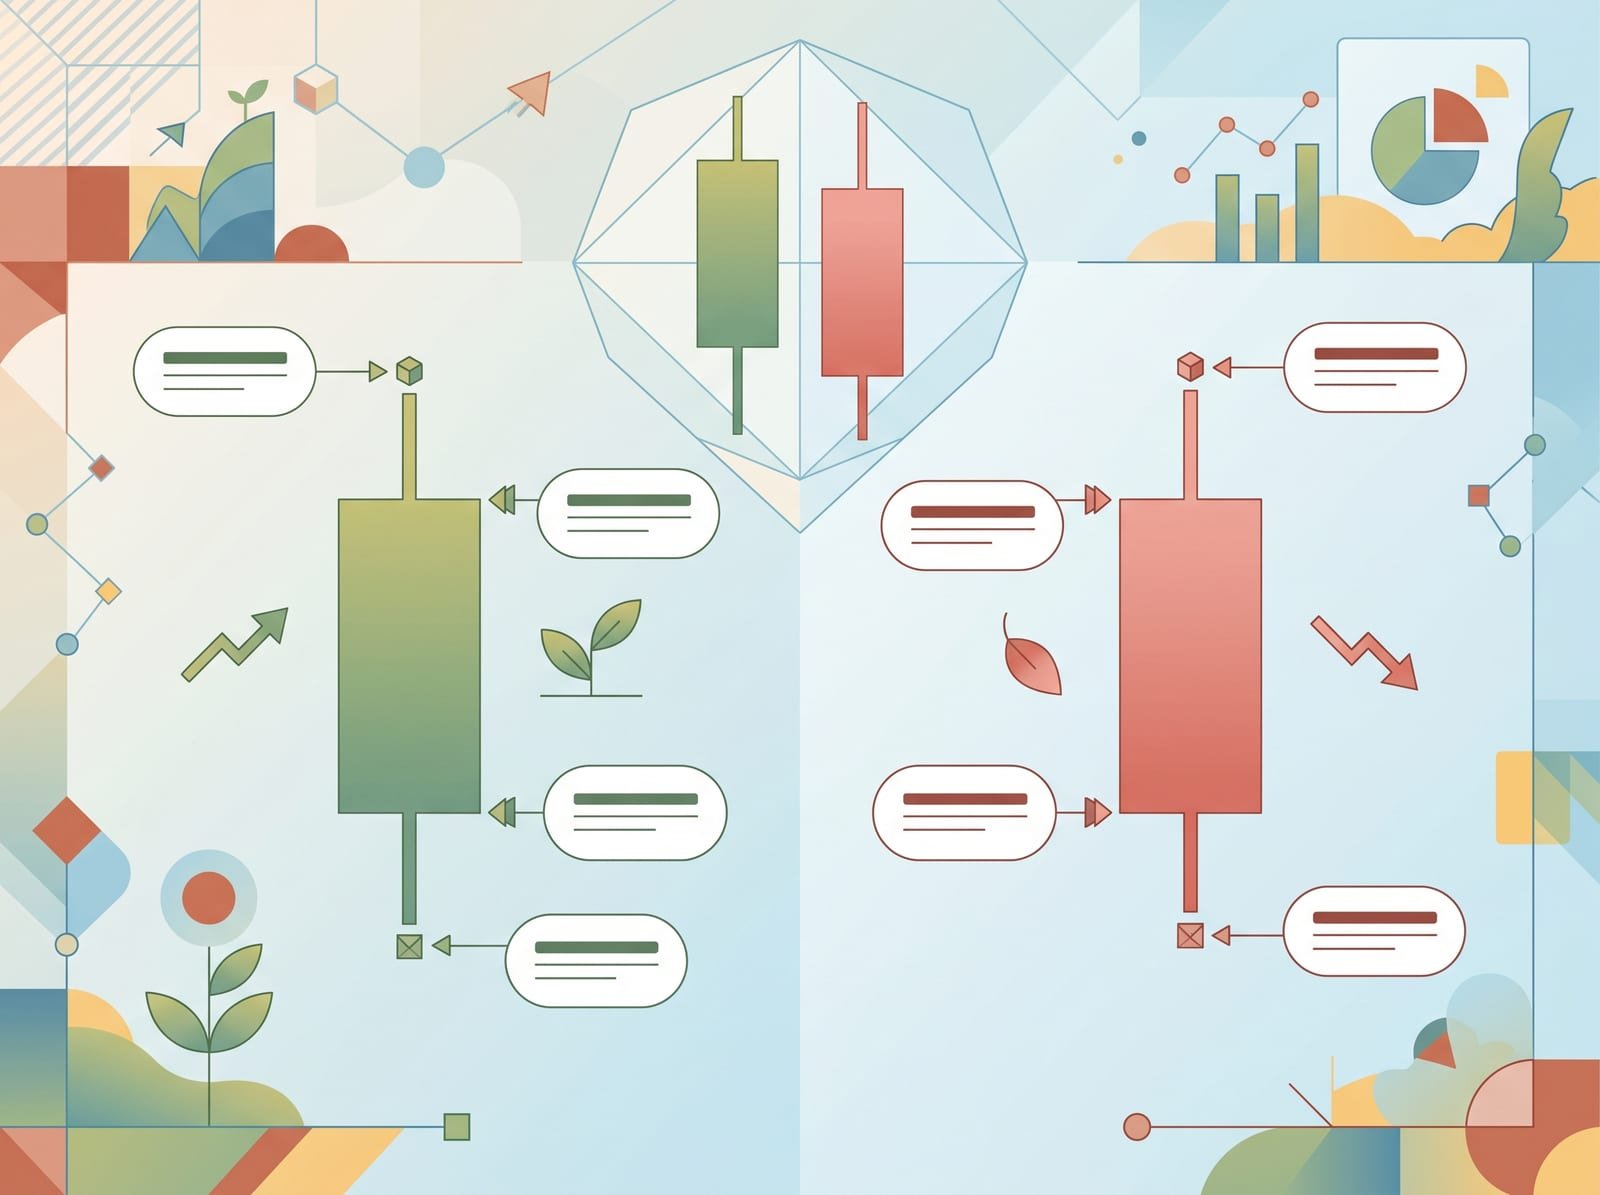
Each candlestick shows the opening, closing, highest, and lowest prices within a specific period.
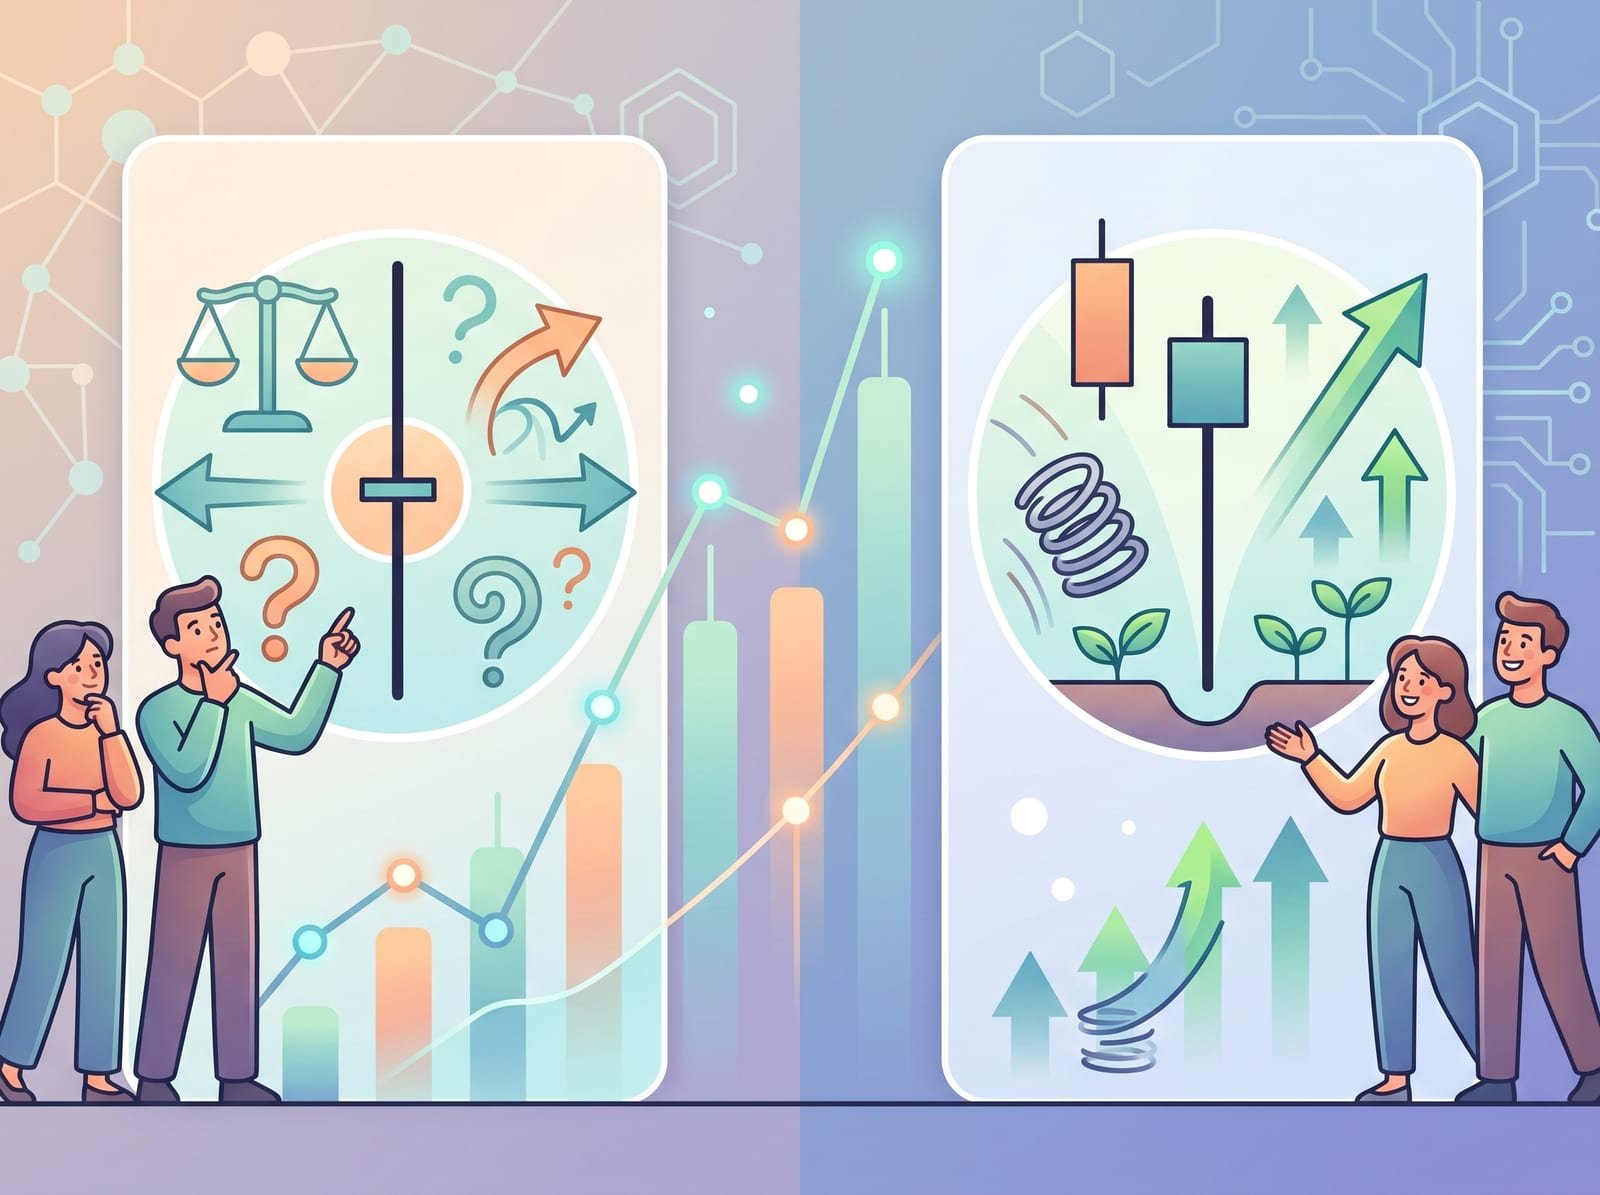
Patterns like doji and hammer can indicate market indecision or potential trend reversals.
Combine candlestick charts with other tools and market analysis for better decision-making.
In the realm of trading, whether it involves stocks, commodities, or cryptocurrencies, understanding market trends is essential. One of the tools traders rely on to gain insights into market movements is the candlestick chart. This chart offers a visual representation of price changes over a specific time period, allowing traders to make more informed decisions. The origins of candlestick charts date back to the 17th century when Japanese rice traders noticed that emotions played a significant role in market pricing. This observation led to the creation of candlestick charts, which not only depict price data but also reflect the emotional state of the market.
A candlestick on a chart represents five key pieces of information for a specific time period: the opening price, closing price, highest price, lowest price, and the direction of price movement. The main part of the candlestick, known as the "real body," shows the range between the opening and closing prices. If the closing price is higher than the opening, the candlestick is usually green or white, indicating a price increase. Conversely, if the closing price is lower, it's typically red or black, indicating a price decrease. The thin lines above and below the body are called wicks or shadows, representing the highest and lowest prices during the period.
Candlestick patterns are combinations of one or more candlesticks that can suggest potential market trends. Recognizing these patterns requires practice and an understanding of the market context. One common pattern is the doji, which resembles a cross. It forms when the opening and closing prices are nearly equal, suggesting market indecision. Another pattern is the hammer, which features a small body with a long wick below, indicating a potential reversal from a bearish to a bullish trend.
Traders often look for specific candlestick patterns to help predict market movements. An engulfing pattern involves two candles, where the second candle completely engulfs the first. A bullish engulfing pattern occurs when a green candle engulfs a red one, suggesting a potential upward trend. The morning and evening star patterns, consisting of three candlesticks, can signal reversals; a morning star indicates a bullish reversal, while an evening star indicates a bearish reversal. In a harami pattern, a small candlestick is contained within the body of the previous, larger candlestick, signaling potential trend changes.
Candlestick charts provide valuable insights into historical price actions and potential future movements. However, they should not be used in isolation. It's crucial to consider other factors such as overall market trends, news events, and additional technical indicators. Understanding the context is key; for example, a pattern like a harami is meaningful only if there is a prior trend that might be reversed. While candlesticks can offer clues about market sentiment, they do not predict future prices with certainty. Therefore, candlestick charts should be used alongside other market analysis tools. Building a solid understanding of these charts can enhance your financial literacy and prepare you for discussions about market trends, whether in family conversations or future employment in finance-related fields.
This lesson was rewritten by Prison Professors for educational use, inspired by Binance Academy. The original article remains the property of its authors.
Legal disclaimer: This material has been prepared for general informational purposes only and should NOT be: (1) considered an individualized recommendation or advice; and (2) relied upon for any investment activities. All information is provided on an as-is basis and is subject to change without notice, we make no representation or warranty of any kind, express or implied, regarding the accuracy, validity, reliability, availability or completeness of any such information. Prison Professors Charitable Corporation does NOT provide investment, legal, or tax advice in any manner or form. The ownership of any investment decision(s) exclusively vests with you after analyzing all possible risk factors and by exercising your own independent discretion. Prison Professors Charitable Corporation shall not be liable for any consequences thereof.
After reading this lesson, reflect on the following questions. Write at least two to four paragraphs for each prompt. You may use your responses as journal entries or lesson reports on your Prison Professors profile.