Basic Education on Crypto
Explore technical analysis, charts, and indicators to understand cryptocurrency market trends.

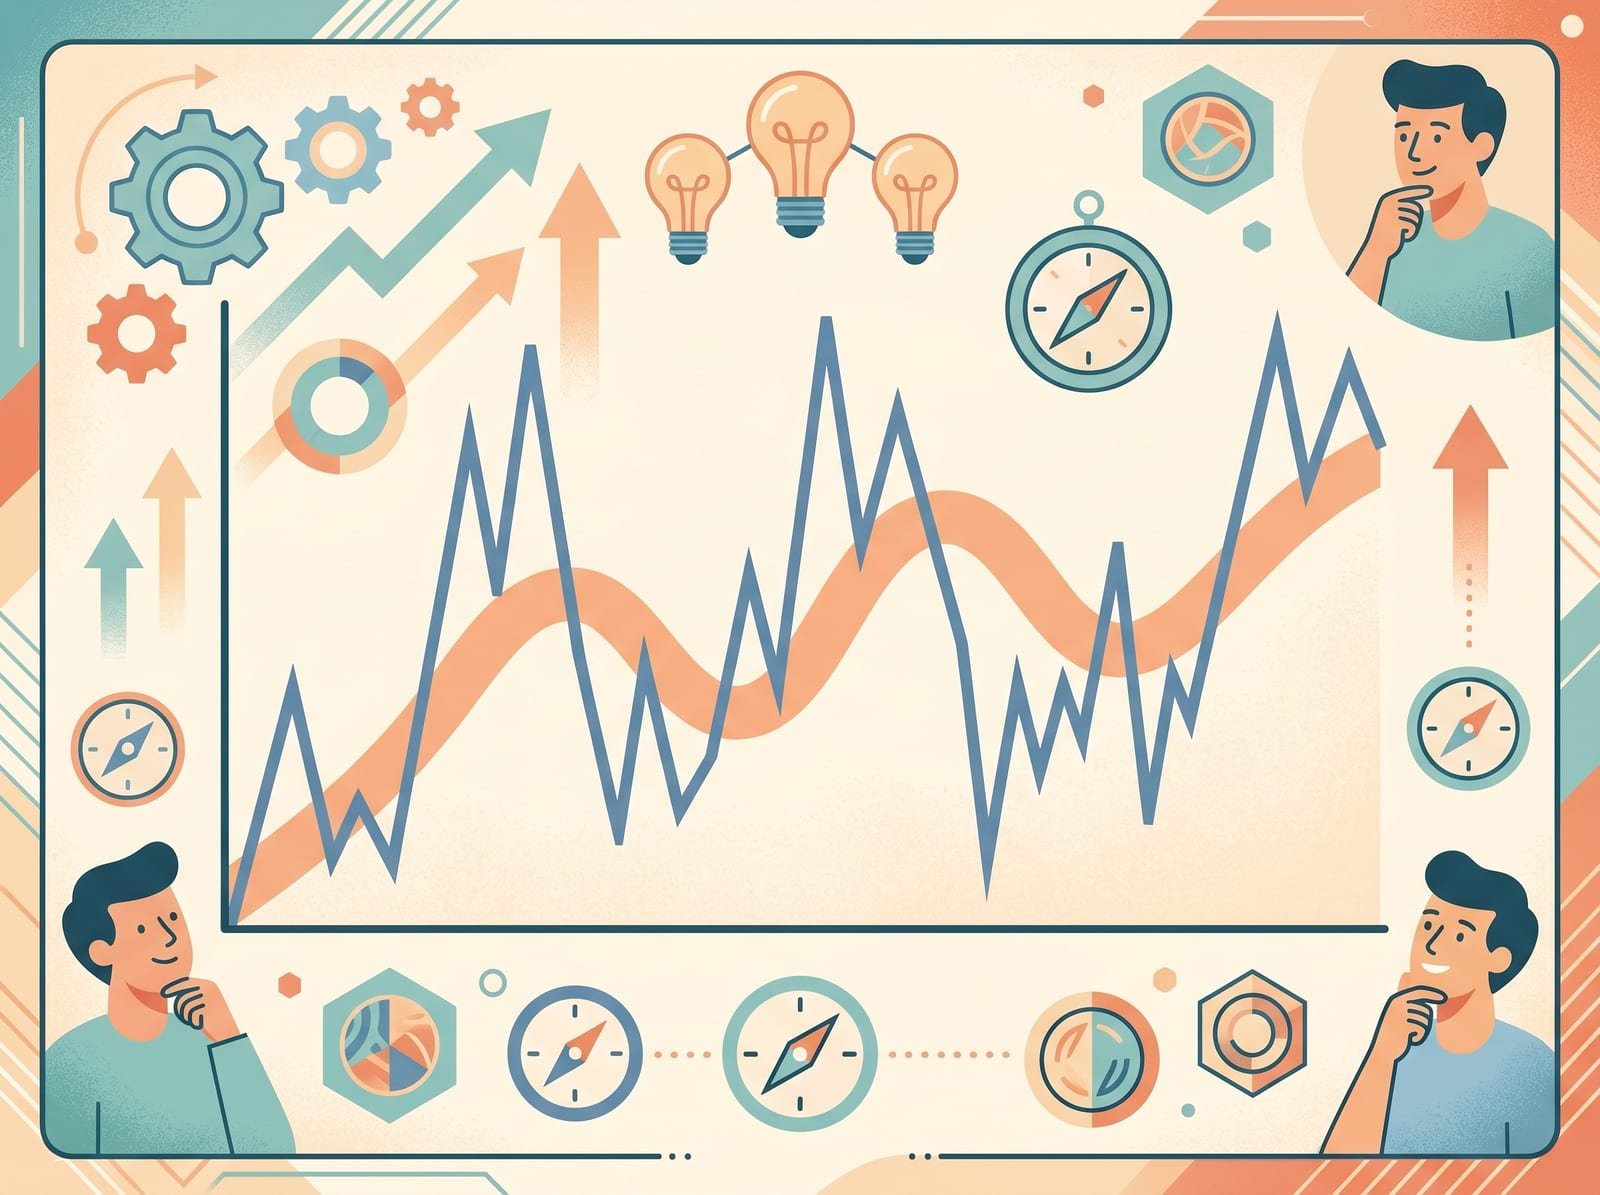
A method to evaluate future price movements by analyzing past market data, focusing on price and volume.
Visual tools that display historical price movements, essential for conducting technical analysis.
Tools that help interpret market data and identify trading opportunities by signaling market trends.
Crucial to manage your risk by diversifying strategies and not investing more than you can afford to lose.
Technical analysis is a technique used to evaluate and predict the future price movements of assets like cryptocurrencies by examining past market data, mainly price and volume. The core idea is that history tends to repeat itself, and by studying historical patterns, traders can make informed predictions about future price movements. This method was pioneered by Charles Dow, a journalist who helped establish the Wall Street Journal and the Dow Jones Industrial Index. Dow's work laid the foundation for modern technical analysis, which is now an essential skill for traders seeking to understand market trends.
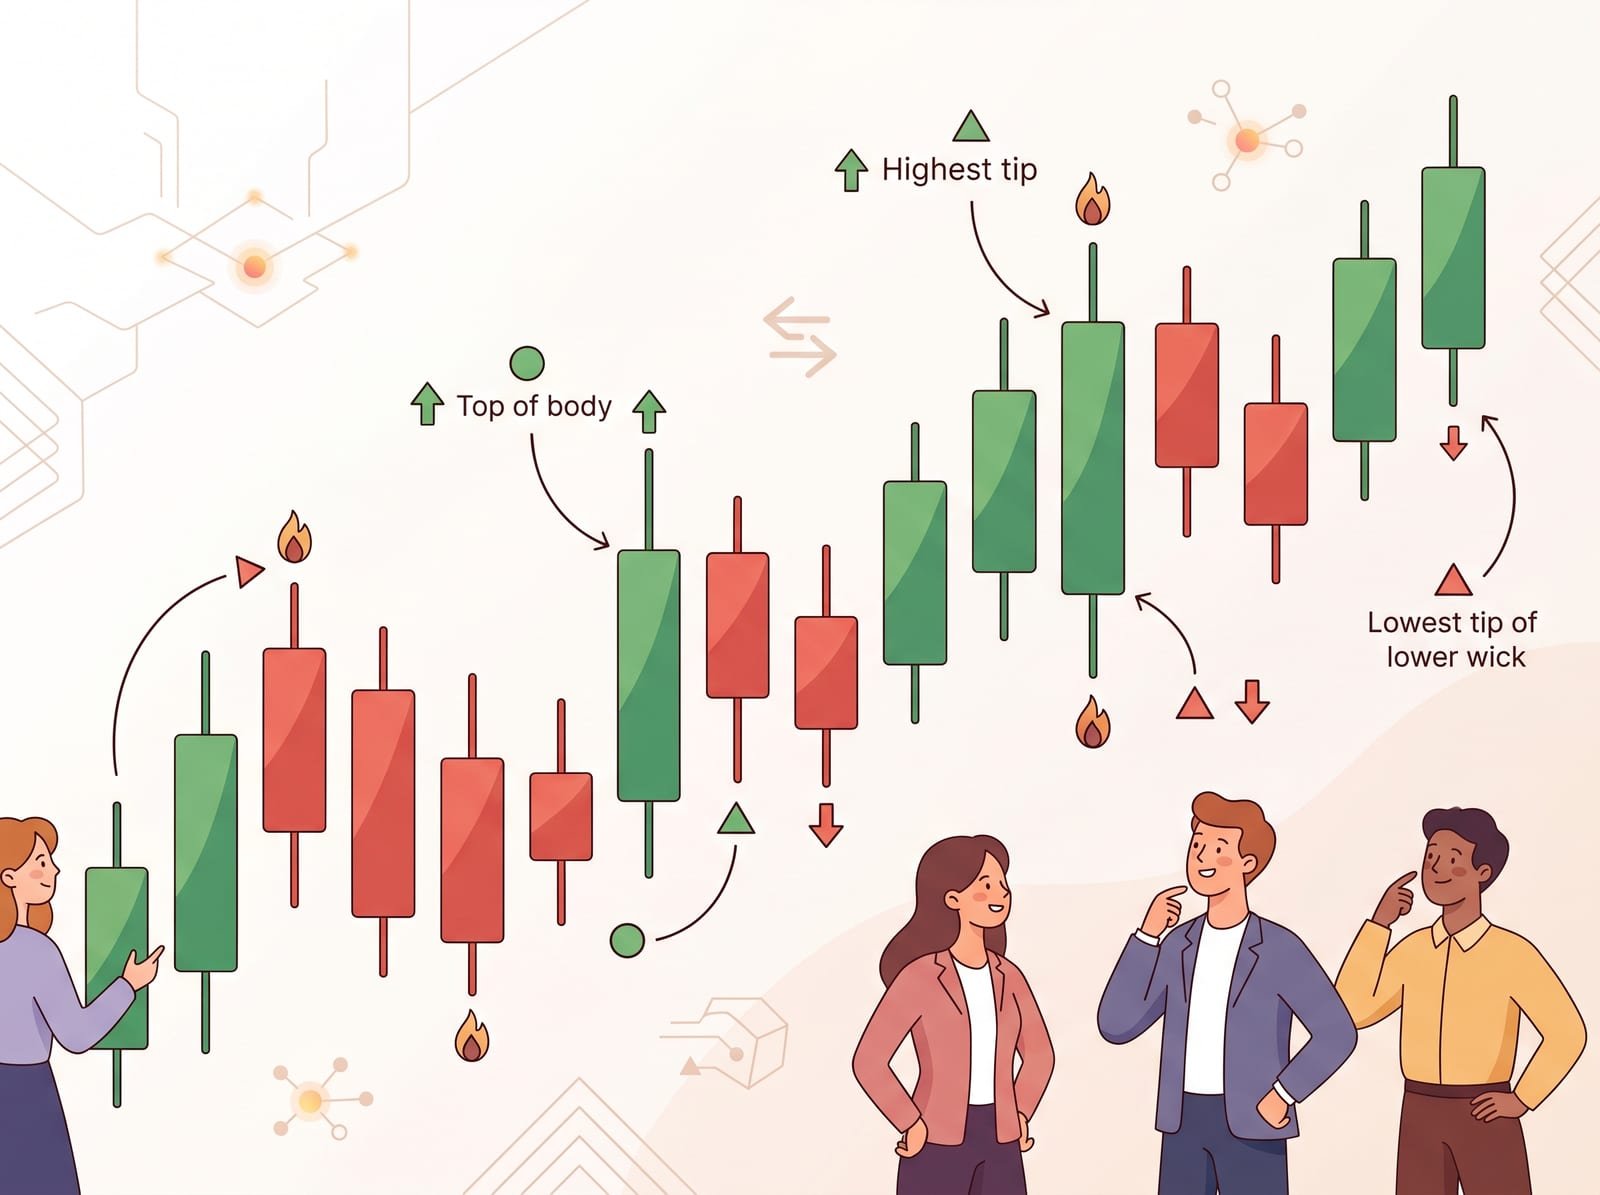
Trading charts are visual tools that display the price movements of an asset over time, essential for conducting technical analysis. They provide a snapshot of how prices have changed historically. One popular type of chart is the candlestick chart. Each candlestick represents price movements within a specific time period, showing the open, high, low, and close prices. A green candlestick indicates the closing price was higher than the opening price, while a red candlestick shows the opposite. Understanding these charts is crucial for recognizing patterns and making informed decisions.
Indicators are tools that help traders interpret market data and identify potential trading opportunities. They provide insights into market trends and can signal when it might be a good time to buy or sell an asset. Indicators can be classified into three types: leading, lagging, and coincident. Leading indicators predict future price movements, lagging indicators confirm trends after they begin, and coincident indicators occur simultaneously with price changes. Traders often use a combination of these indicators to develop strategies and make informed decisions.
Several technical indicators are widely used in cryptocurrency trading. Each provides different insights into market conditions:
Understanding these indicators can enhance your analysis of market trends and potential opportunities.
For beginners, it's important to start by learning how to read trading charts and understand basic indicators. As you become more familiar with these concepts, you can begin to develop your own trading strategies. Consider the timeframe you want to analyze and choose indicators that align with your goals. It's also critical to manage your risk by not investing more than you can afford to lose and by diversifying your strategies. Lastly, track and analyze the results of your strategies to understand what works and refine your approach over time.
This lesson was rewritten by Prison Professors for educational use, inspired by Binance Academy. The original article remains the property of its authors.
Legal disclaimer: This material has been prepared for general informational purposes only and should NOT be: (1) considered an individualized recommendation or advice; and (2) relied upon for any investment activities. All information is provided on an as-is basis and is subject to change without notice, we make no representation or warranty of any kind, express or implied, regarding the accuracy, validity, reliability, availability or completeness of any such information. Prison Professors Charitable Corporation does NOT provide investment, legal, or tax advice in any manner or form. The ownership of any investment decision(s) exclusively vests with you after analyzing all possible risk factors and by exercising your own independent discretion. Prison Professors Charitable Corporation shall not be liable for any consequences thereof.
After reading this lesson, reflect on the following questions. Write at least two to four paragraphs for each prompt. You may use your responses as journal entries or lesson reports on your Prison Professors profile.