Trading
Explore cómo los gráficos de velas pueden ayudar a predecir las tendencias del mercado y los movimientos de los precios en el trading.

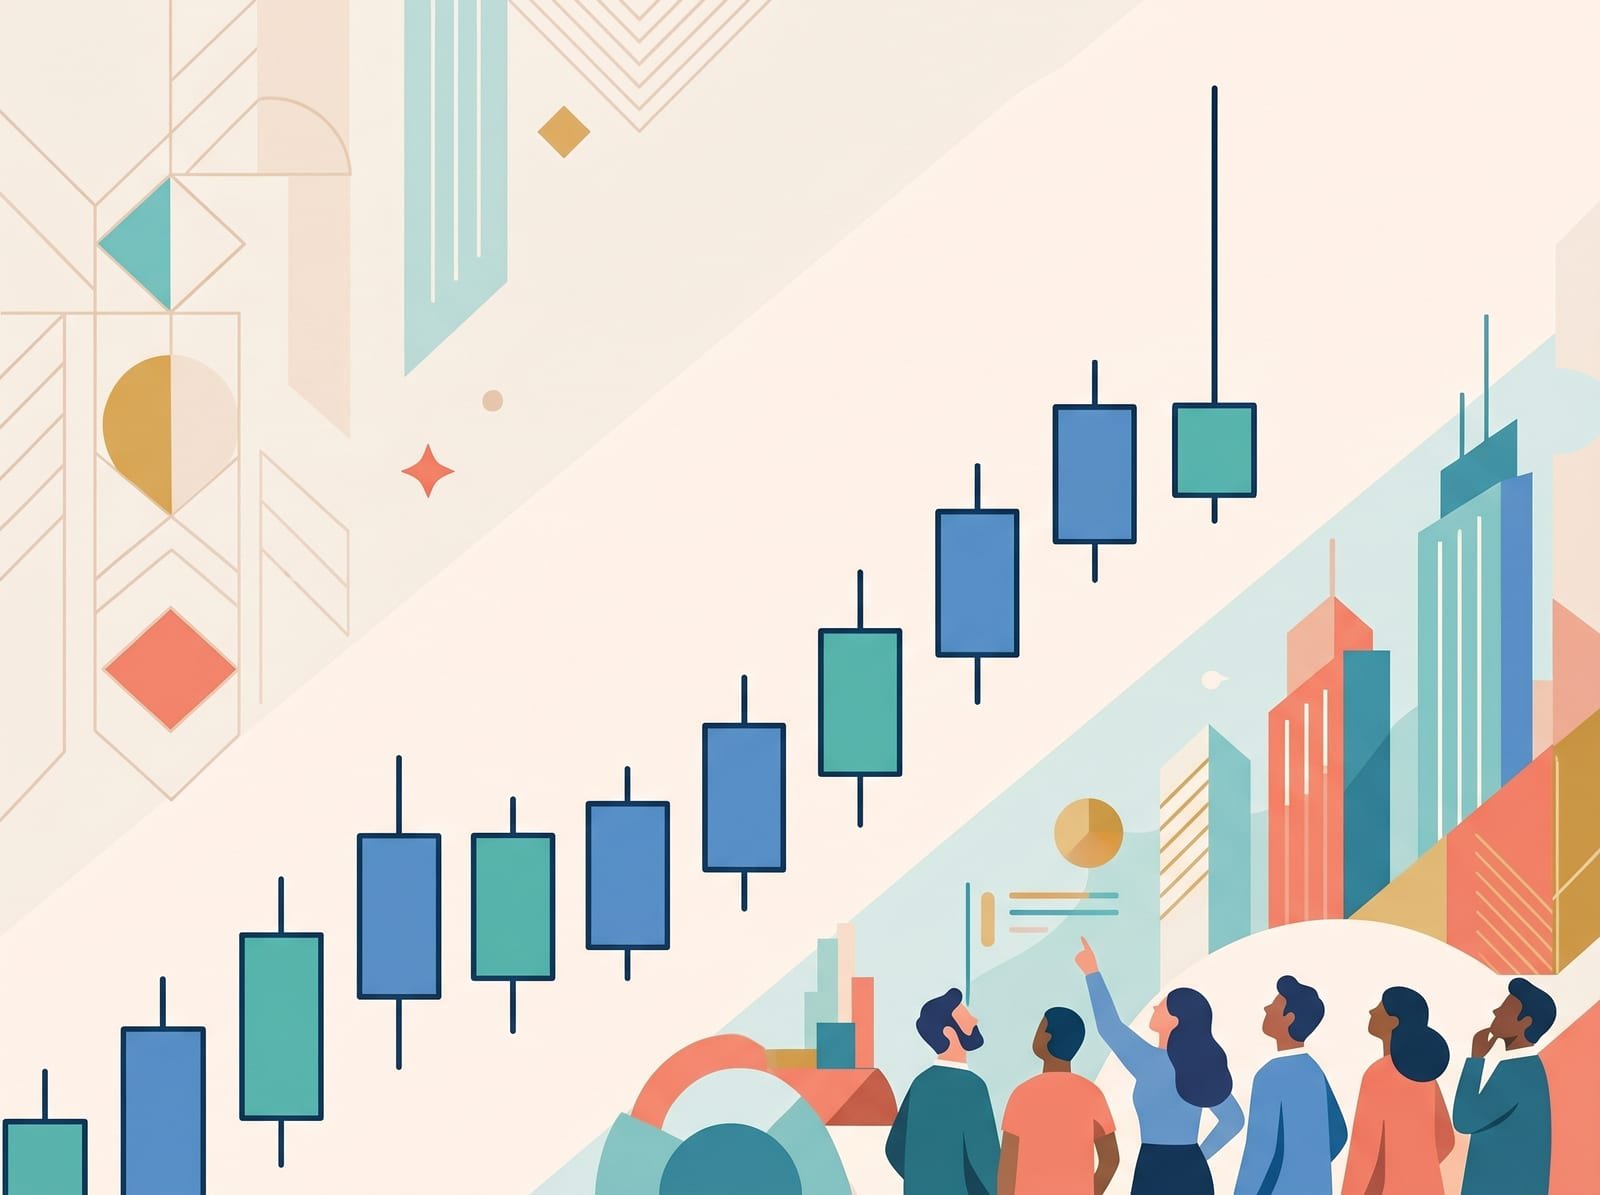
Los gráficos de velas muestran los movimientos de los precios a lo largo del tiempo, lo que ayuda a los operadores a evaluar el sentimiento del mercado.
Patrones como el martillo y los tres soldados blancos sugieren posibles movimientos al alza de los precios.
Patrones como el hombre colgado y los tres cuervos negros indican posibles tendencias a la baja.
Los patrones Doji reflejan la indecisión del mercado y pueden señalar retrocesos o continuaciones.
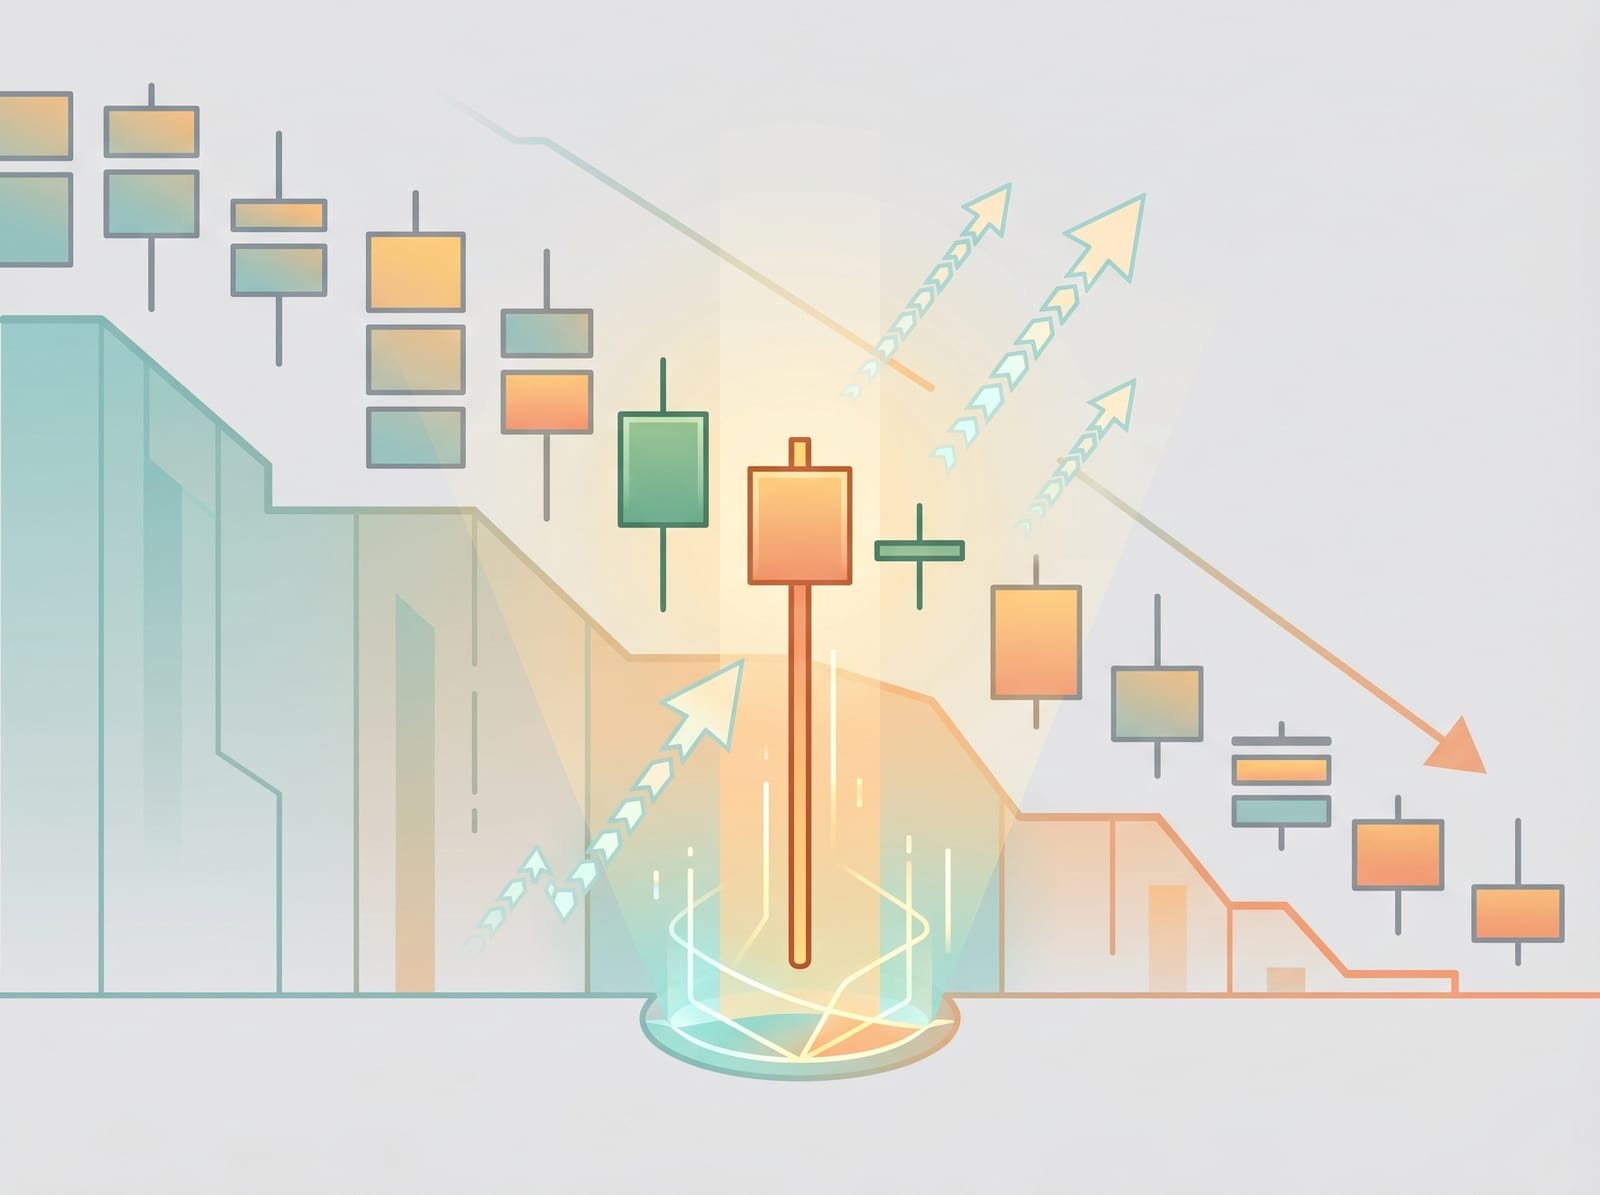
Los gráficos de velas son una herramienta fundamental en el análisis técnico, utilizada por los operadores para evaluar cómo se mueven los precios a lo largo del tiempo. Estos gráficos, que se originaron en Japón hace siglos, siguen siendo cruciales hoy en día porque ofrecen una representación visual del sentimiento del mercado. Cada vela del gráfico representa un intervalo de tiempo específico y muestra los precios de apertura, cierre, máximo y mínimo. El cuerpo de la vela muestra el rango entre los precios de apertura y cierre, mientras que las mechas, o sombras, indican los precios máximo y mínimo durante ese periodo. Comprender estos componentes puede ayudar a anticipar posibles tendencias del mercado.
Los patrones de reversión alcista sugieren que los precios pueden empezar a subir, lo que indica que los compradores podrían tomar pronto el control. Estos patrones suelen aparecer al final de una tendencia bajista.
Martillo: Esta vela se caracteriza por un cuerpo pequeño y una mecha inferior larga, y aparece al final de una tendencia bajista. Indica que los vendedores empujaron el precio a la baja, pero los compradores intervinieron para volver a impulsarlo al alza, lo que sugiere una posible reversión.
Martillo invertido: similar al martillo, el martillo invertido tiene un cuerpo pequeño y una mecha superior larga. Aparece durante una tendencia bajista, lo que indica que los compradores están tanteando el terreno, posiblemente preparándose para un aumento de precios.
Tres soldados blancos: Este patrón consiste en tres velas verdes consecutivas, cada una de las cuales abre dentro del cuerpo de la vela anterior y cierra al alza. Sugiere una fuerte presión compradora y una posible continuación de la tendencia alcista.
Los patrones de reversión bajista indican que los precios pueden empezar a caer, lo que señala que los vendedores podrían dominar pronto el mercado. Estos patrones suelen formarse en la cima de una tendencia alcista.
El hombre colgado: El hombre colgado se asemeja al martillo, pero aparece en la parte superior de una tendencia alcista. Su larga mecha inferior sugiere que la presión de venta está aumentando, aunque los compradores lograron volver a impulsar el precio al alza.
Estrella fugaz: La estrella fugaz tiene un cuerpo pequeño con una larga mecha superior y se forma al final de una tendencia alcista. Indica que el precio ha alcanzado un máximo y que los vendedores están ganando fuerza.
Tres cuervos negros: Este patrón es el opuesto a los tres soldados blancos y consiste en tres velas rojas consecutivas. Cada una abre dentro del cuerpo de la vela anterior y cierra más abajo, lo que sugiere una presión de venta sostenida.
Los patrones de continuación indican que es probable que la tendencia actual persista. Reconocerlos puede ayudar a los operadores a decidir si mantener o ajustar sus posiciones.
Tres métodos ascendentes: Este patrón aparece en una tendencia alcista y se caracteriza por tres pequeñas velas rojas seguidas de una gran vela verde. Sugiere una consolidación temporal antes de que se reanude la tendencia alcista.
Tres métodos bajistas: El patrón de los tres métodos bajistas es el opuesto a los tres métodos alcistas. Se produce en una tendencia bajista y consiste en tres pequeñas velas verdes seguidas de una gran vela roja, lo que indica la continuación de la tendencia bajista.
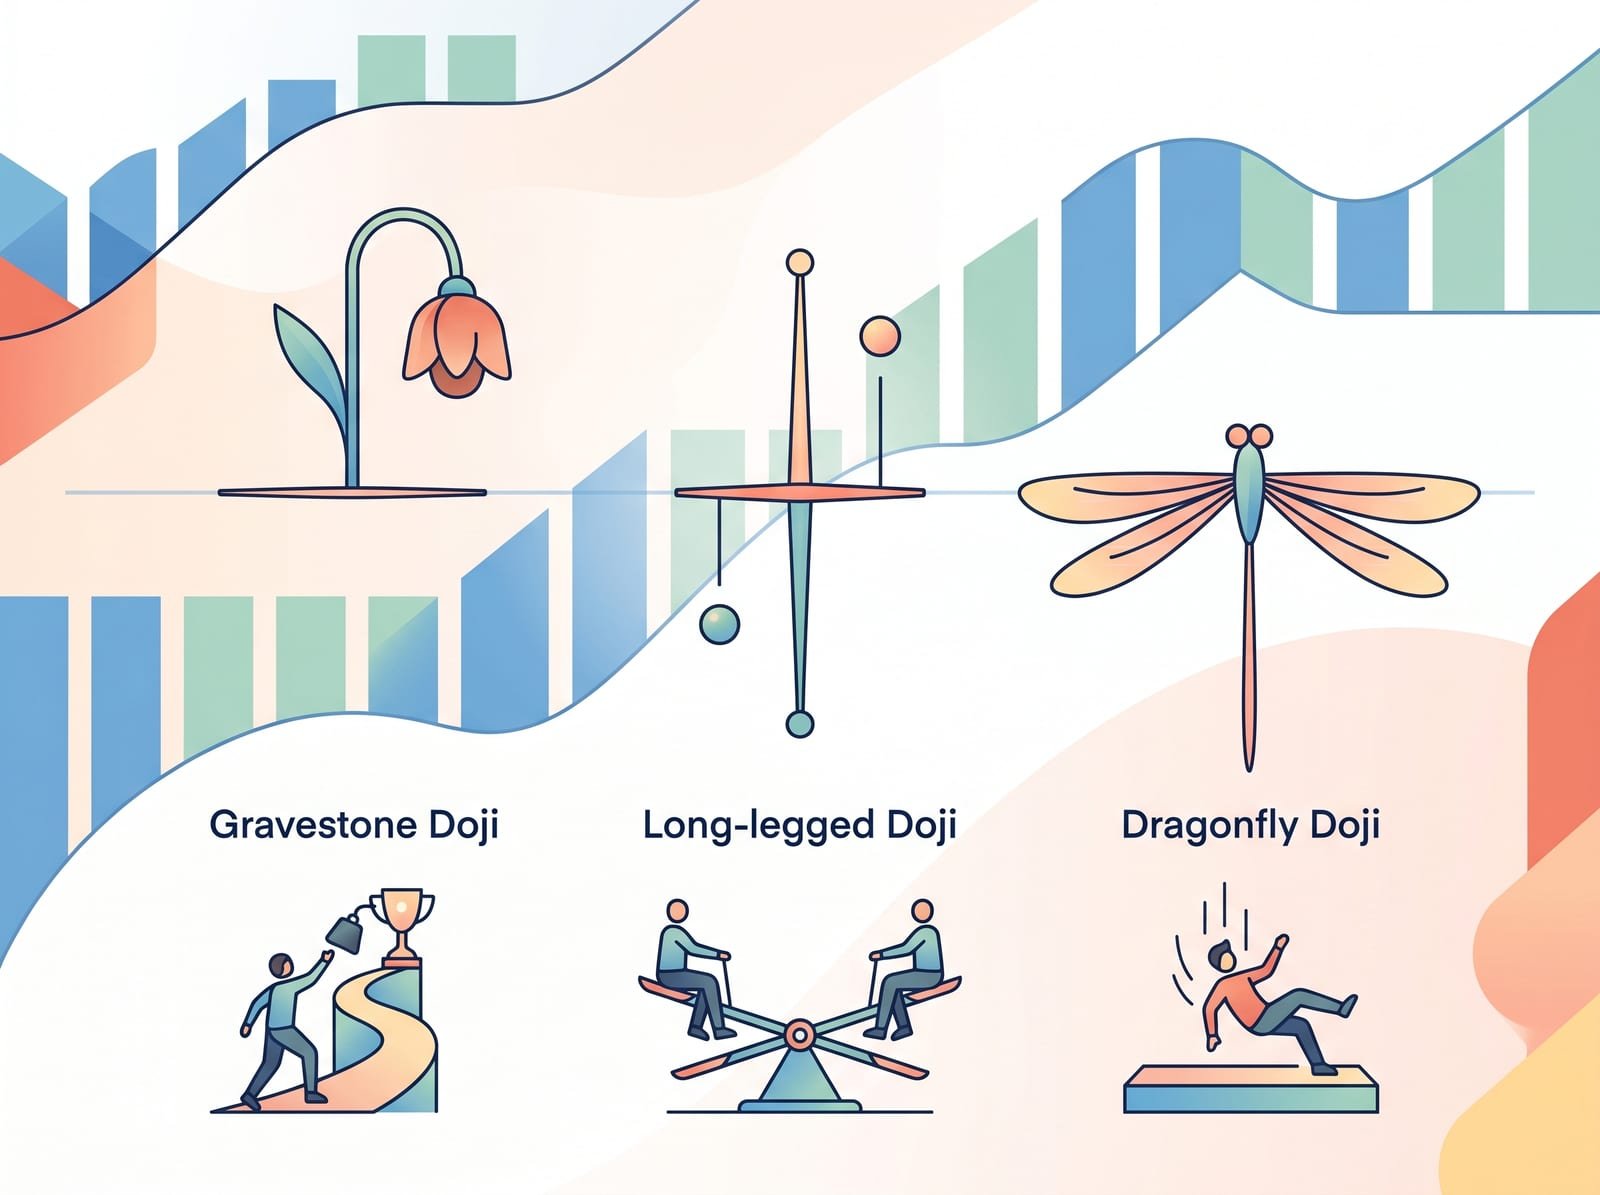
Un Doji se forma cuando los precios de apertura y cierre son casi iguales, creando una forma similar a una cruz. Significa indecisión en el mercado, sin que ni los compradores ni los vendedores tomen el control. Dependiendo de su posición y contexto, un Doji puede indicar una posible reversión o continuación.
Entre los diferentes tipos de Doji se incluyen el Doji Lápida, el Doji de Piernas Largas y el Doji Libélula, cada uno de los cuales ofrece información única en función de su formación y ubicación en el gráfico.
Comprender los patrones de velas japonesas es una habilidad valiosa en el trading, ya que proporciona información sobre posibles movimientos del mercado. Aunque estos patrones pueden señalar posibles tendencias, son más eficaces cuando se utilizan junto con otras herramientas de análisis y factores de mercado. Recuerda que ningún patrón por sí solo garantiza un resultado específico, por lo que siempre debes tener en cuenta el contexto general del mercado.
Esta lección ha sido reescrita por Prison Professors con fines educativos, inspirándose en Binance Academy. El artículo original sigue siendo propiedad de sus autores.
Aviso legal: Este material se ha elaborado únicamente con fines informativos generales y NO debe: (1) considerarse una recomendación o un consejo individualizado; ni (2) servir de base para ninguna actividad de inversión. Toda la información se proporciona «tal cual» y está sujeta a cambios sin previo aviso; no ofrecemos ninguna garantía de ningún tipo, expresa o implícita, en cuanto a la exactitud, validez, fiabilidad, disponibilidad o integridad de dicha información. Prison Professors Charitable Corporation NO proporciona asesoramiento de inversión, jurídico o fiscal de ninguna manera ni forma. La responsabilidad de cualquier decisión de inversión recae exclusivamente en usted, tras analizar todos los posibles factores de riesgo y ejercer su propio criterio independiente. Prison Professors Charitable Corporation no se hace responsable de ninguna consecuencia derivada de ello.
Después de leer esta lección, reflexiona sobre las siguientes preguntas. Escribe al menos de dos a cuatro párrafos para cada pregunta. Puedes utilizar tus respuestas como anotaciones en tu diario o como informes de la lección en tu perfil de Profesores de Prisiones.